# Easy Trade Pro Strategy tests results - NIFTY BANK's INDEX FUTURES
In the complex world of financial trading, strategy is paramount. The ability to predict market trends and capitalize on them separates successful traders from the rest. To help illustrate the efficacy of various trading strategies, we're introducing a series of examples, showcasing the potential outcomes and the dynamics involved.
> ❗**IMPORTANT**❗
**1) Our strategies have been tested with simulated leverage, but we've always adhered to a principle of preserving capital. We ensure that the risk per trade never exceeds 3%**. While these simulations give an idea of potential leveraged outcomes in the spot market trading, it's crucial to remember that using leverage amplifies both potential profits and potential losses. For example, with x5 leverage, a net profit of 30% would translate to 150%. However, the same amplification applies to losses. Always approach leverage with caution and an understanding of the increased risks involved.
**2)The initial capital and order size mentioned in our trading studies, such as 1,000,000 INR capital and an order size of 4 contracts, are used purely as examples with round numbers for illustrative purposes.** Due to the nature of our study, and since we are using a currency different from USD, we've opted for contracts as our method for placing orders. This approach allows us to conduct the backtest accurately and effectively. We encourage you to adapt the data to your own situation and choose the capital and order size that align with your personal trading preferences and risk tolerance.
**3)**For buy and sell orders, we implemented custom terminology based on our Buy & Sell Trading Indicator, Easy Trade Pro. Don't worry if you find these unfamiliar - these terms are custom to our system and used for our unique trading strategy. If you want understand more about it please [**review the Easy Trade Pro Guide, as it covers essential information on custom orders.**](https://docs.tradingparadise.io/trading-paradise-complete-guidebook/easy-trade-buy-and-sell-strategy-indicator/easy-trade-pro)
**4)** When evaluating a trading strategy's performance, it's essential to understand two key metrics: Maximum Drawdown and Maximum Underwater.
* **Maximum Drawdown** refers to the largest drop from a peak to a trough in the cumulative profit over a specific period. It represents the greatest loss from a peak point to the lowest point before a new peak is achieved. It's a key measure of the riskiness of a strategy, as it gives an idea of the potential loss in a worst-case scenario.
* **Maximum Underwater**, on the other hand, refers to the lowest point the cumulative profit dips into the negative before it starts to recover. This measure can help understand the resilience of a strategy during downturns and its ability to recover from losses.
While both Maximum Drawdown and Maximum Underwater provide valuable insights into a strategy's performance, in our case, **Maximum Underwater might be a more important metric. This is because it represents the most significant actual loss suffered over the entire trading period. It essentially reveals the strategy's resilience and its ability to recover from this worst-case scenario. Understanding the Maximum Underwater helps us grasp the real risk we are taking on in the given timeframe, which is critical for managing risk and expectations.**
{% hint style="info" %} **For a detailed breakdown of individual trades, including points where the strategy was in negative profit, you can refer to the trades list in the provided PDF. This can provide a more granular understanding of the strategy's performance over time.**
{% endhint %}
**----------------------------------------------------------------------------------------------**
**1) BANKNIFTY1! 15-min, INDEX FUTURES:**
* **I*****nitial Capital:*** INR 1,000,000
* **Leverage:** X10
* ***Buy Order Size:*** 25 contracts (avg price per contract INR 43,043). Our capital 2.5 contracts, we borrowed 22.5 contracts.
* **Time zone:** UTC + 5:30
* ***Date:*** 2022/09/21 to 2023/09/21
* ***Stop Loss:*** 2%
* ***Buy \[custom order type]:*** Good Buy Bull + 2 candle of confirmation
* ***Sell \[custom orders]:*** 4 different sell orders where we unload 25% of the position at each order
* ***Sell \[custom orders types]:*** We set as take profit 5% and we take profit on the way up, so at TP 1 1.25%, TP2 2.5%, TP3 3.75%, TP4 5%
**To access complete details of the strategy, please take a look at the PDF below:**
{% file src="" %}
**Comment:** In our TradingView backtest study of index futures in currencies other than USD, we had to use contracts as our entry method, as it isn't possible to perform the backtest otherwise. With an initial capital of 1,000,000 INR (roughly $12,000), we utilized 10x leverage and traded 25 contracts for each position. Given the average price per contract was 43,043 INR, our capital covered 2.5 contracts, while the remaining 22.5 contracts were borrowed through leverage.
For each trade, we risked roughly 2.15% of our initial capital of 1,000,000 INR. This is determined by taking the total order cost (43,043 INR x 25 = 1,076,075 INR) and applying a 2% stop loss, which equates to a risk of 21,521 INR.
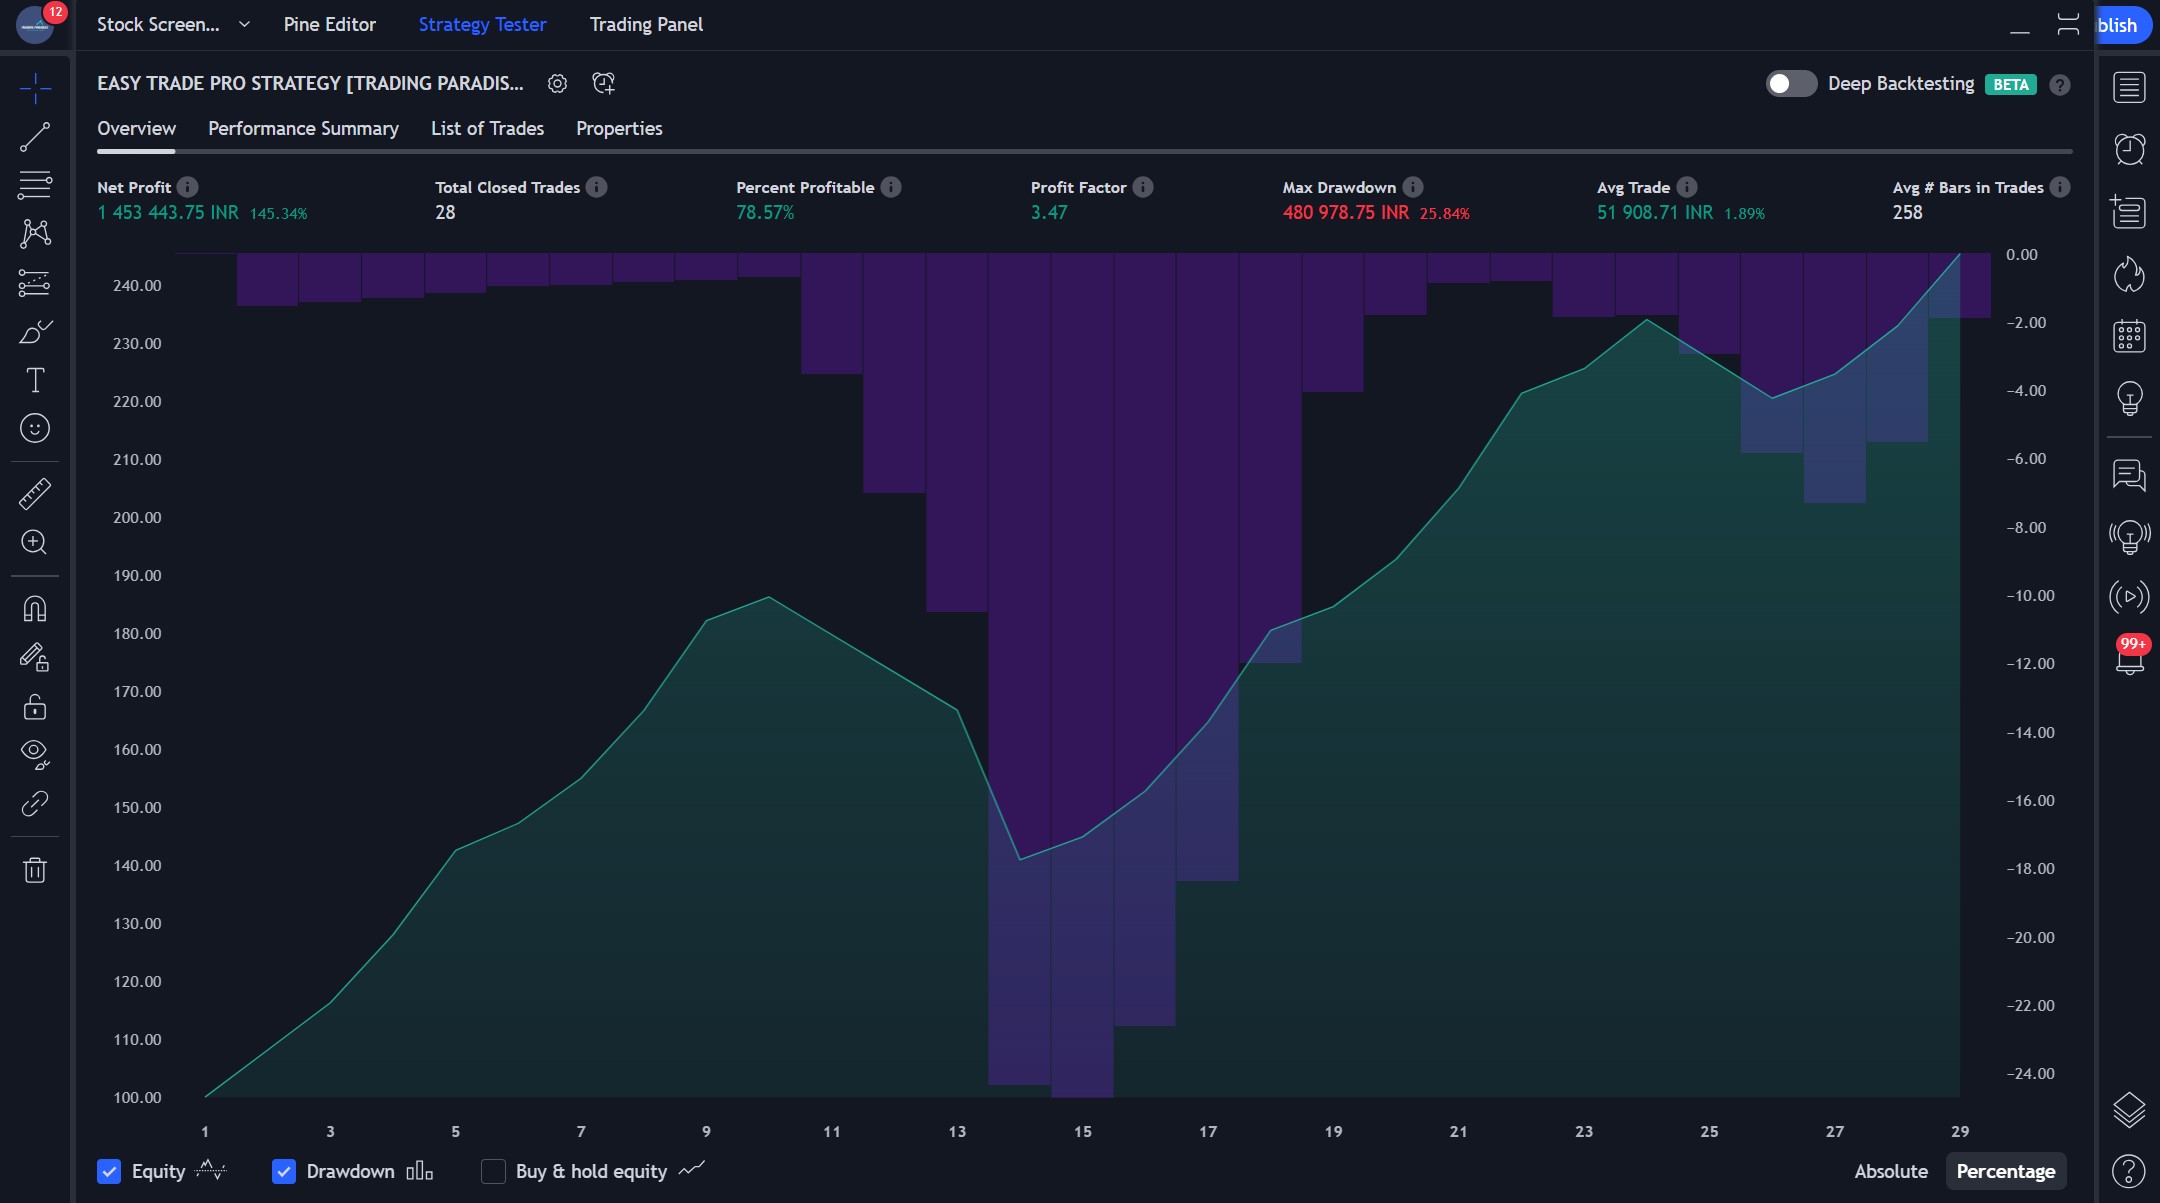
**Throughout the study, we recorded an impressively high win rate of 78.57% and a net profit of 1,453,443.75 INR, 154.34% of our initial capital.**
**If we use the same input in the 5 min chart we have:**
From the data, it's evident that while this strategy may not yield many trades annually on both the 15 min and 5 min charts, its effectiveness is undeniable. With a notable win rate and net profit, we've ensured that our capital risk per trade remains below 2.15%.
**Take action now for instant access!**
> [**https://www.tradingparadise.io/pricing**](https://www.tradingparadise.io/pricing)