# Easy Trade Pro Strategy tests results - US500
In the complex world of financial trading, strategy is paramount. The ability to predict market trends and capitalize on them separates successful traders from the rest. To help illustrate the efficacy of various trading strategies, we're introducing a series of examples, showcasing the potential outcomes and the dynamics involved.
> ❗**IMPORTANT**❗
**1) Our strategies have been tested with simulated leverage, but we've always adhered to a principle of preserving capital. We ensure that the risk per trade never exceeds 3%**. While these simulations give an idea of potential leveraged outcomes in the spot market trading, it's crucial to remember that using leverage amplifies both potential profits and potential losses. For example, with x5 leverage, a net profit of 30% would translate to 150%. However, the same amplification applies to losses. Always approach leverage with caution and an understanding of the increased risks involved.
**2) Our TradingView strategy studies primarily focus on timeframes from 5 minute to 1 hour**, **but on US500 we also tested 1 minute**. ideal for automated strategies. However, you're welcome to test these strategies on higher timeframes according to your trading preferences.
**3)** The initial capital and order size mentioned in our trading studies, such as $10,000 USD capital and $1,000 or $2,000 order size, are used purely as examples with round numbers for illustrative purposes. **We encourage you to adapt the data to your own situation and choose the capital and order size that align with your personal trading preferences and risk tolerance.**
**4) Beware of unrealistic promises like strategy+ 90% win rates and + 500% net profits. They're often signs of misinformation. We stand for authentic, tested trading strategies.**
{% hint style="info" %}
**5)** [**Before proceeding, please ensure you've reviewed the Easy Trade Pro Guide, as they cover essential information on custom orders.**](https://docs.tradingparadise.io/trading-paradise-complete-guidebook/easy-trade-buy-and-sell-strategy-indicator/easy-trade-pro)
{% endhint %}
**6)** Our recommendation for buy entries is to utilize custom orders such as **'Bullish Reversal' and similarly, 'Bearish Reversal' or 'Good Sell' for sell orders.**
{% hint style="info" %}
**Signals like 'Great Buy' and 'Incredible Buy' are quite rare and typically unsuitable for automated strategies due to their infrequency. ****If you are inclined to try these orders, we suggest doing so on very low timeframes, such as 15 minutes or less, where they occur more frequently.**
**We have excluded the 'Great Sell' and 'Incredible Sell' orders from the backtesting system because these signals are not suitable for automated strategies due to their infrequent occurrence. However, in manual trading, these signals should not be underestimated when they do appear on the chart. It's beneficial to seize these opportunities and take advantage of these signals when they occur.**
{% endhint %}
**7)** When evaluating a trading strategy's performance, it's essential to understand two key metrics: Maximum Drawdown and Maximum Underwater.
* **Maximum Drawdown** refers to the largest drop from a peak to a trough in the cumulative profit over a specific period. It represents the greatest loss from a peak point to the lowest point before a new peak is achieved. It's a key measure of the riskiness of a strategy, as it gives an idea of the potential loss in a worst-case scenario.
* **Maximum Underwater**, on the other hand, refers to the lowest point the cumulative profit dips into the negative before it starts to recover. This measure can help understand the resilience of a strategy during downturns and its ability to recover from losses.
While both Maximum Drawdown and Maximum Underwater provide valuable insights into a strategy's performance, in our case, **Maximum Underwater might be a more important metric. This is because it represents the most significant actual loss suffered over the entire trading period. It essentially reveals the strategy's resilience and its ability to recover from this worst-case scenario. Understanding the Maximum Underwater helps us grasp the real risk we are taking on in the given timeframe, which is critical for managing risk and expectations.**
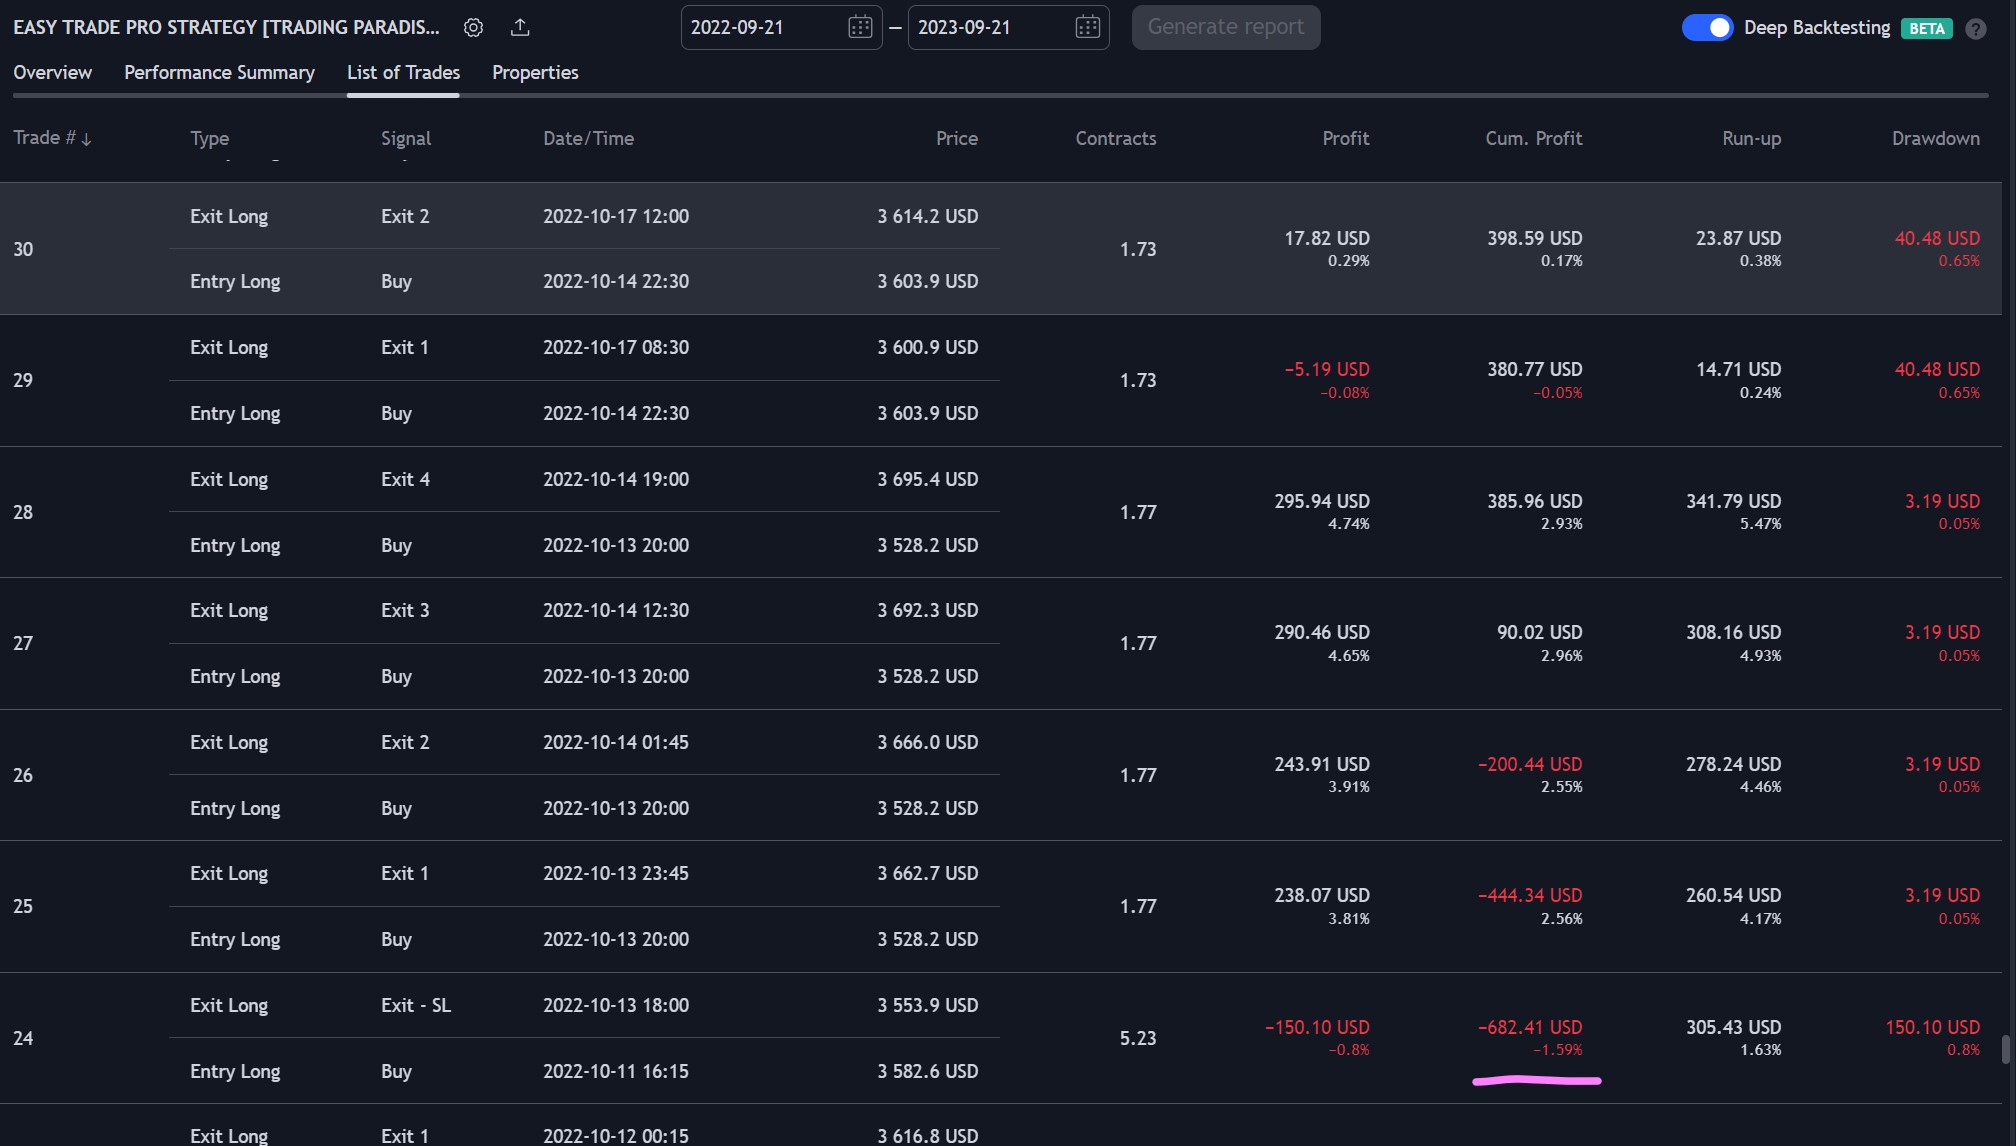
{% hint style="info" %} **For a detailed breakdown of individual trades, including points where the strategy was in negative profit, you can refer to the trades list in the provided PDF. This can provide a more granular understanding of the strategy's performance over time.**
{% endhint %}
**----------------------------------------------------------------------------------------------**
**1) US500 15-minute, Pepperstone Broker:**
* **I*****nitial Capital:*** $10,000
* ***Leverage:*** X25
* ***Buy Order Size:*** $25,000 (our capital $1,000, we borrowed $24,000)
* **Time zone:** UTC + 3
* ***Date (y/m/d):*** 2022/09/21 to 2023/09/21 (We decided to test 1 year of data on Pepperstone)
* ***Stop Loss:*** 0.8%
* ***Buy \[custom order type]:*** Bullish Reversal + 2 candle of confirmation
* ***Sell \[custom orders]:*** 4 different sell orders where we unload 25% of the position at each order
* ***Sell \[custom orders types]:*** 1TP 'Good Sell', 2TP 'Good Sell Bear', 3TP 'Bearish Reversal' + 0 candle of confirmation, 4TP 'Bearish Reversal' + 0 candle of confirmation
**To access complete details of the strategy, please take a look at the PDF below:**
{% file src="" %}
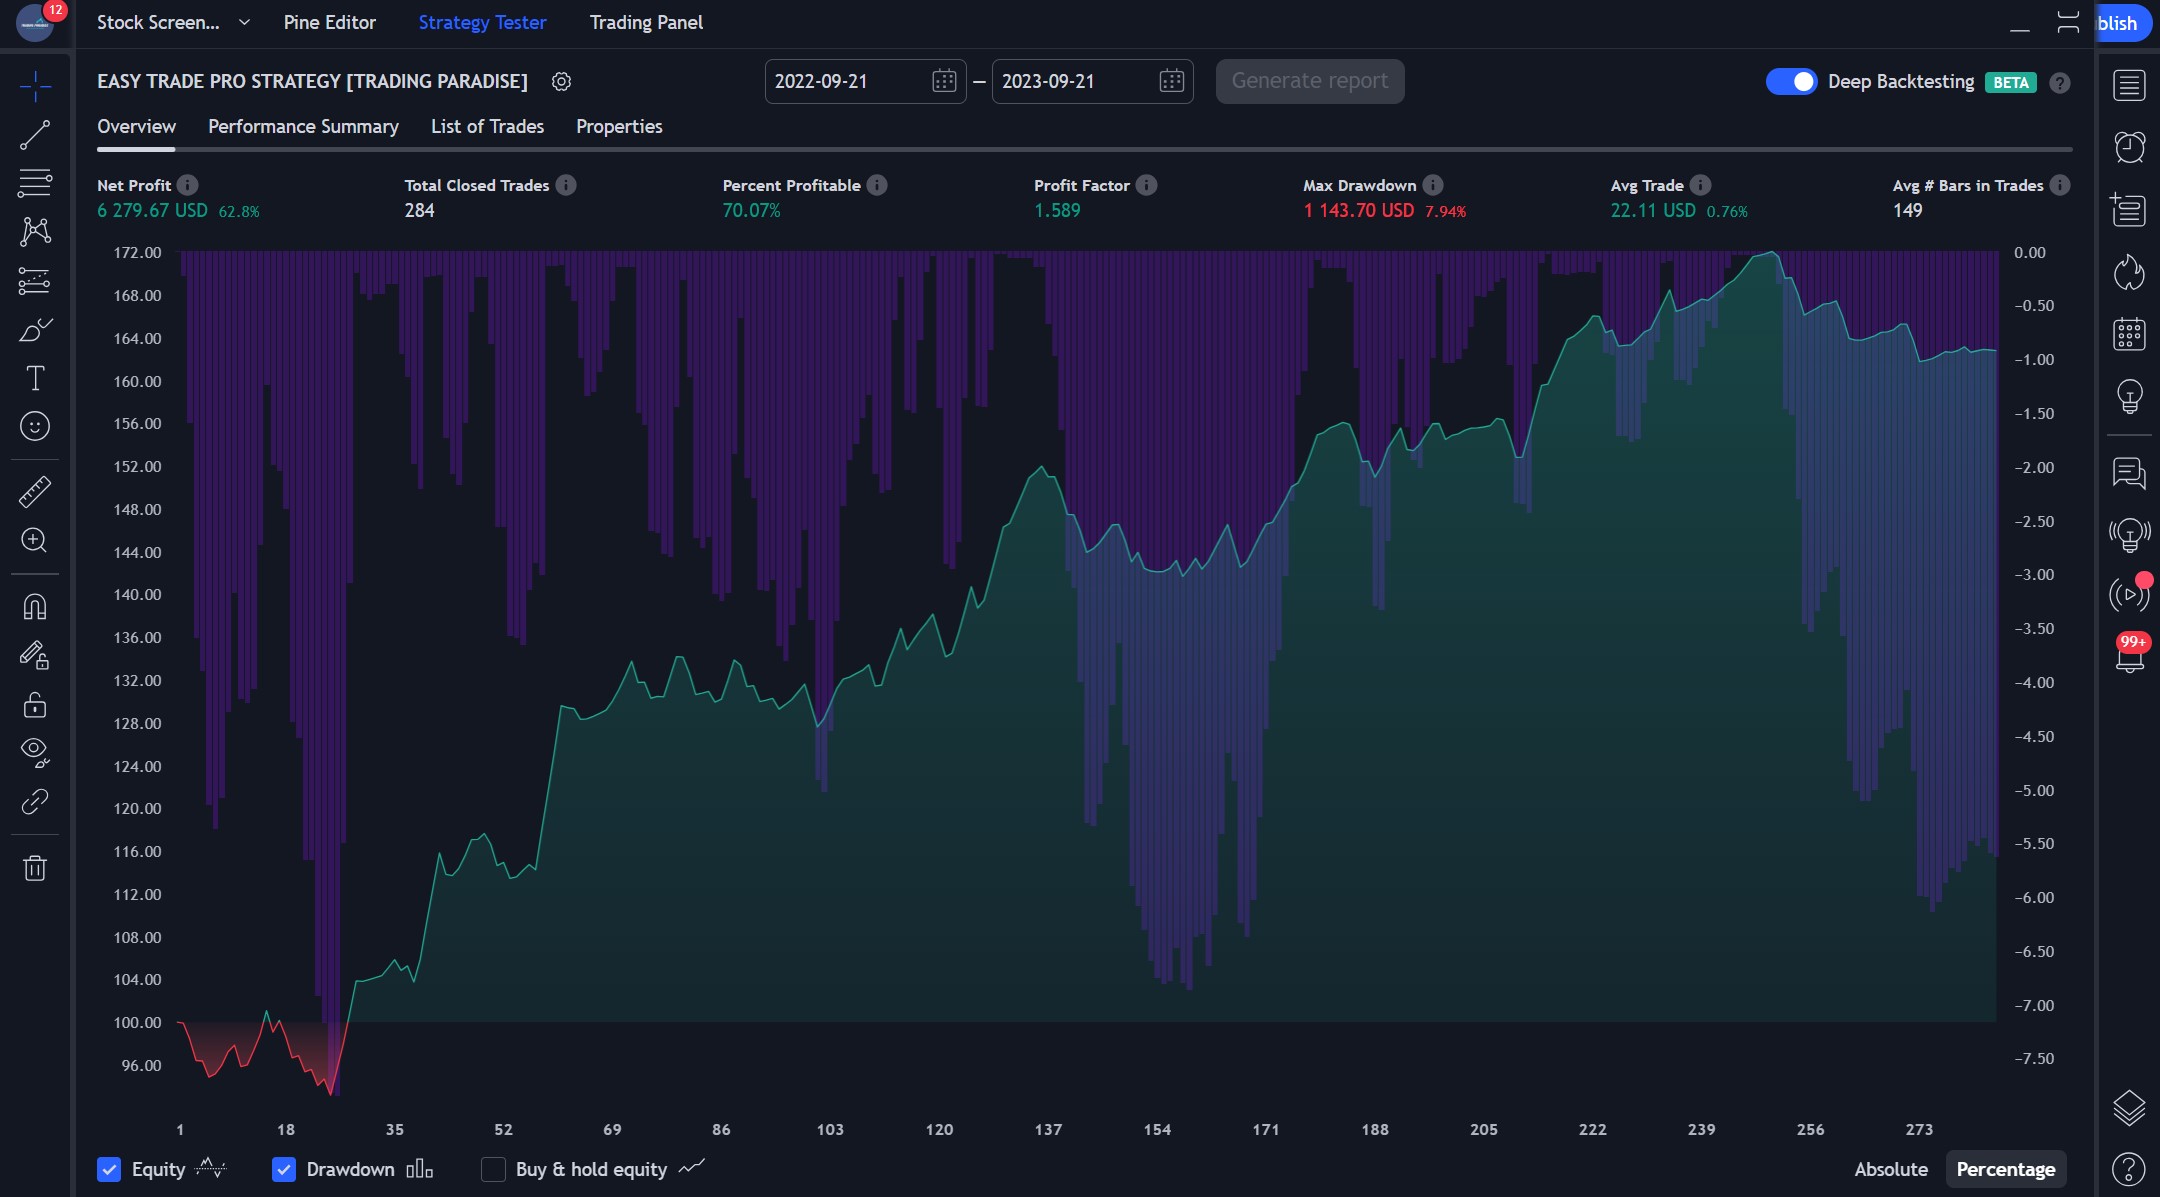
This strategy study has been conducted on US500 on a 15-min Chart, Pepperstone broker. From 2022/09/21 to 2023/09/21. In this strategy, we've simulated the results of 25x leverage, a practice widely employed in futures.
By doing this, we need to maintain a low risk per trade. Let's break it down. We start with an initial capital of $10,000 and an order size of $1,000. With the application of 25x leverage, our order size increases to $25,000. Despite this increase, we've managed to keep the stop loss at 0.8%.
**Consequently, the risk per trade remains at a manageable level. To be specific, here's how the calculation works: Our risk per trade is the product of our order size ($25,000) and our stop loss (0,8%). That comes to $200, which is 2% of our initial capital.**
We take profits in 4 different sell orders where we unload 25% of the position at each order. Please note that the buy and sell orders are custom signals with unique names. So, if they seem unfamiliar, there's no cause for concern. To gain a deeper understanding of Easy Trade Pro and its operation, we invite you to read the instruction manual of the indicator:
k/easy-trade-buy-and-sell-strategy-indicator/easy-trade-pro-with-backtesting-system
**Our trading strategy has showcased impressive results. Out of 284 closed trades, we secured a 70.7% win rate, leading to a net profit of $6,279.67, a 62.08% increase from our initial $10,000 capital.** While the drawdown was a moderate 7.94%, our strategy showed resilience with the Maximum Underwater metric registering a minor dip of just $682.41 on 2022/10/13.
What is the Maximum Underwater metric? Maximum Underwater represents the most significant dip in cumulative profit before a recovery. It's a crucial indicator of a strategy's fortitude during downturns and its recovery potential. In our analysis, it reveals the actual risk endured over the trading period, helping us effectively manage risk and set accurate expectations.
**Take action now for instant access!**
> [**https://www.tradingparadise.io/pricing**](https://www.tradingparadise.io/pricing)
**2) US500 1-minute, Pepperstone Broker:**
* **I*****nitial Capital:*** $10,000
* ***Leverage:*** X30
* ***Buy Order Size:*** $60,000 (our capital $2,000, we borrowed $58,000)
* **Time zone:** UTC + 3
* ***Date (y/m/d):*** 2023/07/13 to 2023/10/13
* ***Stop Loss:*** 0.3%
* ***Buy \[custom order type]:*** Incredible Buy + 0 candle of confirmation
* ***Sell \[custom orders]:*** 4 different sell orders where we unload 25% of the position at each order
* ***Sell \[custom orders types]:*** 1TP 'Good Sell', 2TP 'Bearish Reversal' + 1 candle of confirmation, 3TP 'Good Sell', 4TP 'Bearish Reversal' + 1 candle of confirmation
**To access complete details of the strategy, please take a look at the PDF below:**
{% file src="" %}
This strategy study has been conducted on US500 on a 1-min Chart, Pepperstone Broker. In this strategy, we've simulated the results of 30x leverage, a practice widely employed in Futures. By doing this, we need to maintain a low risk per trade. Let's break it down.
We start with an initial capital of $10,000 and an order size of $2,000. With the application of 30x leverage, our order size increases to $60,000. Despite this increase, we've managed to keep the stop loss at 0.3%. Consequently, the risk per trade remains at a manageable level.
**To be specific, here's how the calculation works: Our risk per trade is the product of our order size ($60,000) and our stop loss (0,3%). That comes to $180, which is 1.8% of our initial capital.**
We take profits in 4 different sell orders where we unload 25% of the position at each order. Please note that the buy and sell orders are custom signals with unique names. So, if they seem unfamiliar, there's no cause for concern. To gain a deeper understanding of Easy Trade Pro and its operation, we invite you to read the instruction manual of the indicator:
k/easy-trade-buy-and-sell-strategy-indicator/easy-trade-pro-with-backtesting-system
**Our trading strategy has showcased impressive results. Out of 194 closed trades, we secured a 69.07% win rate, leading to a net profit of $1,412.66, a 14.13% increase from our initial $10,000 capital.**
**Take action now for instant access!**
> [**https://www.tradingparadise.io/pricing**](https://www.tradingparadise.io/pricing)